TL;DR: What are Core Web Vitals?
Core Web Vitals are a set of metrics proposed by Google to measure how users experience the speed, responsiveness, and visual stability of a page. Essentially, they reflect the real-world experience of a user interacting with a web page. They represent a subsection of Web Vitals, which, in total, encapsulates a broader spectrum of user experiences.
Why are Core Web Vitals important?
User experience is paramount. With an overwhelming number of websites vying for attention, delivering a smooth and fast user experience can set a website apart from its competitors. Google has emphasized the importance of Core Web Vitals by incorporating them into its ranking criteria. This means that websites optimized with these metrics in mind can expect improved visibility in search results, potentially leading to increased traffic and conversions.
Understanding Core Web Vitals Metrics
Google has distilled the user experience into three primary metrics that matter the most to users when navigating websites. Let's break down each one:
Largest Contentful Paint (LCP)
Largest Contentful Paint measures the time it takes for the largest content element on a webpage to be visible to users upon entering that page. Google specifies that this metric considers only above-the-fold content.
Typically, this content might be an image, video, or a block of text. A good LCP is crucial as it indicates that the webpage is loading quickly for a positive user experience.
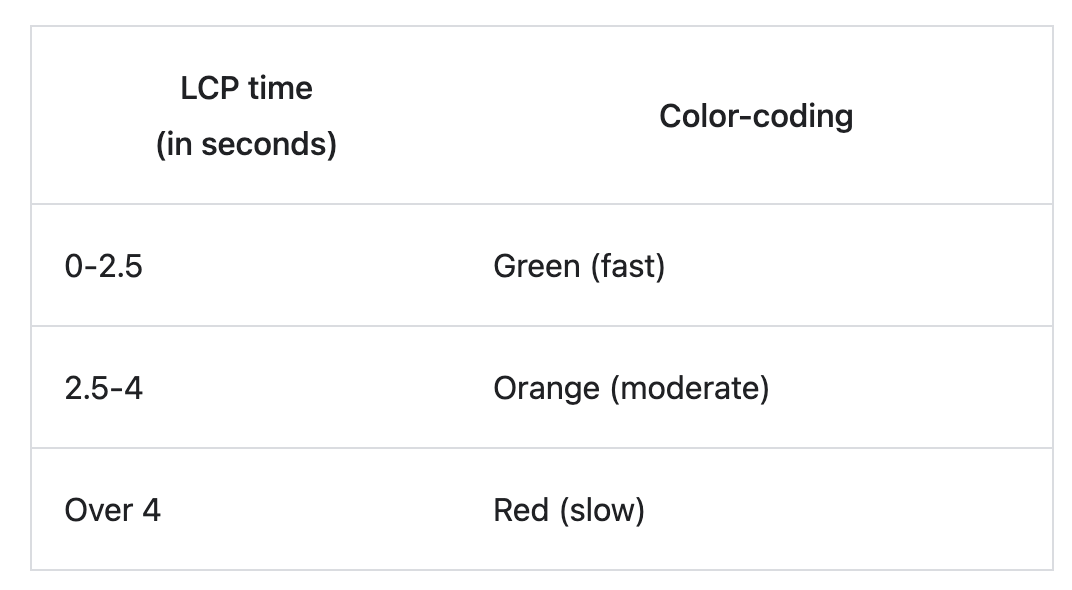
LCP is represented as a time in seconds. Ideally, the LCP should occur within the first 2.5 seconds of the page starting to load.
Google offers this scale for interpreting your LCP score:
Cumulative Layout Shift (CLS)
Cumulative Layout Shift addresses the visual stability of a webpage. CLS quantifies how often users experience unexpected shifts in content layout while navigating a webpage.
This can occur when a visible element suddenly changes position or size, causing a "jump" on the page. Such disruptions can be frustrating and might lead to users accidentally clicking on unintended elements.
Google indicates a CLS score below 0.1 is considered good.
- “Good” CLS: Below 0.10
- “Needs Improvement” CLS: Between 0.10 and 0.25
- “Poor” CLS: Above 0.25
First Input Delay (FID)
First Input Delay gauges the time it takes for a webpage to respond after a user first interacts with it, such as clicking on a link or pressing a button.
This metric is crucial as it sheds light on the user's first impression of a site's interactivity and responsiveness.
FID is represented as time in milliseconds. For an optimal user experience, FID should be less than 100 milliseconds.
- Good: below 100 ms
- Needs Improvement: 100-300ms
- Poor: Above 300ms
Measuring Core Web Vitals
Google has provided a range of tools for webmasters, developers, and even business owners to track and improve their website's vitals.
Gauging the performance of Core Web Vitals requires a combination of field and lab tools, along with some JavaScript solutions for those inclined to measure manually.
Field tools to measure Core Web Vitals
Field tools capture real-world user experience data. Some of the prominent field tools include:
- Google Search Console: This provides a Core Web Vitals report showing how your pages perform based on real-world usage data.
- Chrome User Experience Report: Known as CrUX, this offers user experience metrics for how real-world Chrome users experience popular destinations on the web.
- Web Vitals JavaScript Library: This allows capturing web vitals metrics directly from real users visiting your site.
Lab tools to measure Core Web Vitals
Lab tools are designed for pre-release testing, allowing developers to diagnose issues during the build or optimization phase. Notable tools include:
- Lighthouse: An automated tool for improving the quality of web pages. It provides audits for performance, accessibility, progressive web apps, SEO, and more.
- Chrome DevTools: Provides a suite of web developer tools built directly into the Chrome browser, offering insights into how a website might perform.
Measuring Core Web Vitals in JavaScript
- For those wanting a hands-on approach, the Web Vitals JavaScript library can be used to measure these metrics directly. This is especially beneficial for webmasters who want to integrate these measurements into their analytics or monitoring tools.
Using a combination of field and lab tools provides the most holistic view of how a site performs both in real-world conditions and in controlled testing environments.
Improving Core Web Vitals
Once you've measured and understood your site's performance concerning Core Web Vitals, the next step is optimization. Improving these metrics often leads to a better user experience and potentially better search ranking.
- Optimize Images: Compressing images without compromising quality, using modern formats like WebP, and leveraging lazy loading can significantly improve LCP.
- Use Web Fonts Efficiently: Limiting the number of font families, weights, and styles can help improve page load times.
- Avoid Non-Essential Third-Party Scripts: These can slow down your page, leading to a longer FID. It's crucial to evaluate the necessity of each third-party script on your site.
- Optimize CSS and JS: Minifying and compressing these files, as well as removing any unused code, can expedite page load times.
- Minimize Layout Shifts: This can be achieved by providing size attributes for images & videos, avoiding inserting content above existing content, and utilizing CSS's transform animations instead of margin or top.
- Server Optimization: Consider using a Content Delivery Network (CDN), optimizing server response times, and leveraging browser caching.
Recommendations and Best Practices
For best results, integrate the optimization of Core Web Vitals into your regular web development and maintenance routine.
- Regular Audits: Periodically check your site's performance with tools like Lighthouse or Chrome DevTools to catch and address issues proactively.
- Stay Updated: Google often updates its guidelines and best practices. Being aware of the latest trends and recommendations is key to maintaining optimal site performance.
- Seek Expert Help: If you're uncertain about how to improve specific metrics, consider consulting with a web performance expert or agency.
Related Performance Metrics
While Core Web Vitals are essential for understanding user experience, they are just the tip of the iceberg. Several other performance metrics can elevate the overall experience on your website.
First Contentful Paint (FCP)
FCP measures the time it takes from when the page starts loading to when any part of the page's content is rendered on the screen. It's an important metric to understand how quickly users perceive your site as being loaded. A faster FCP generally leads to a better user experience.
Speed Index
The Speed Index metric reflects how quickly content is visually displayed during page load. Sites with a lower Speed Index will have content that appears faster, offering a more engaging experience for users.
Time to Interactive (TTI)
TTI gauges the time it takes for a page to become fully interactive, where elements respond to user interactions promptly. It's critical because a page that looks interactive should also function as such.
Total Blocking Time (TBT)
TBT quantifies the total time between First Contentful Paint (FCP) and Time to Interactive (TTI) where the main thread was blocked for long enough to prevent input responsiveness. Lower TBT values indicate that the page is more responsive to user inputs.
Page Performance Scores
Often found in tools like Lighthouse, these scores give an aggregate view of your page's performance, accounting for various metrics. Improving individual metrics will typically lead to a higher overall score.
Monitoring your site's performance
Regularly monitoring website performance is crucial for maintaining optimal user experience. Tools like Google Analytics, Google Search Console, and specialized monitoring solutions can provide insights into how your site is performing over time, enabling you to spot and resolve issues before they escalate.
FAQ
Core Web Vitals are a set of specific metrics introduced by Google to measure the quality of user experience on web pages, focusing on loading performance, interactivity, and visual stability.
Google has incorporated Core Web Vitals into its ranking algorithm, meaning web pages optimized for these metrics could experience improved search visibility and potentially higher organic traffic.
A positive user experience, represented by good Core Web Vitals scores, can lead to increased user retention, lower bounce rates, and higher conversion rates, directly influencing a business's revenue.
Tools like Google's PageSpeed Insights, Lighthouse, and Chrome DevTools can provide insights into how a website performs concerning these vitals.
While the metrics themselves are universal, the impact and importance might vary by industry. However, for any industry relying on web traffic, optimizing for these metrics can enhance user experience.
Regular checks, at least quarterly, are advisable. However, after significant website changes or updates, an immediate audit can be beneficial.
Yes, third-party content can impact the loading times and visual stability of a page, potentially affecting metrics like LCP and CLS.
Optimization strategies include image and font optimization, reducing third-party script impacts, improving server response times, and addressing layout shifts.
While the metrics apply to both mobile and desktop, Google has emphasized the mobile experience, making it crucial for sites to optimize for mobile users especially.


